Today we are pleased to feature five guest posts from Tom Ewing’s Virginia Tech Introduction to Data in Social Context class! This final post is from E. Thomas Ewing and Nicholas Bolin.
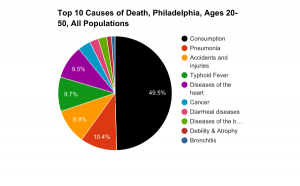
The social impact of tuberculosis in the late nineteenth century was distinguished by the relatively high mortality rate among adult populations. This social impact can be graphically illustrated in a chart showing the relative number of deaths over a six year period in the city of Philadelphia due to the ten most common causes for the adult population, aged 20-50 years. Of these causes, tuberculosis accounts for nearly half — or the same number of the other nine causes combined. Of the approximately 33,000 adult deaths from all causes in this six year period, tuberculosis accounted for more than one-third (35.8%), more than three times as many deaths as other leading causes (typhoid fever, pneumonia, and accidents and injuries). As this graph suggests, the vital statistics collected and analyzed by government agencies, preserved by medical libraries in published form, and now widely accessible through the Medical Heritage Library in digital form are both an excellent source of data for analysis with modern tools and a basis for thinking about the ways that public officials used statistical analysis to identify health concerns and recommend appropriate policies.
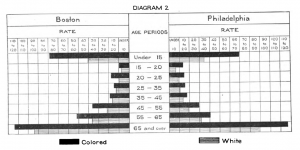
In the late nineteenth century, statisticians used visualizations to illustrate the relative impact of specific diseases and other causes of death and to compare death rates across categories such as race, gender, age, and immigrant status. Illustration 2 is a diagram from Vital Statistics comparing the age at death with the race of victims over a six year period. As a form of visualization, it works very well, because it compares two factors (age and race) in terms of death rates, which made them relative to total population in each category.
The graph for Philadelphia clearly indicates that death rates were consistently higher for African American populations, although this gap was highest among infants and children (under age 15), as compared to the adult and even elderly populations. These patterns suggest that the primary cause for this difference was socio-economic conditions, which are important determinants of infant and child mortality rates. This diagram also clearly illustrates that the highest death rates were among infant and children (60 plus deaths per 1,000 population for African Americans and 30 plus for whites) and the elderly (110 plus for African Americans and almost 90 for whites). Among adults in their most vital years, ages 20 to 50, the death rates were much lower for both populations. This familiar U shaped curve makes the data about the impact of tuberculosis among adults even more striking because it illustrates just how unusual this disease was in its impact on the American population.
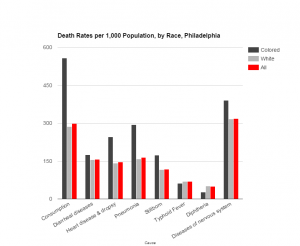
A more detailed comparison of data about race and cause of death can be seen in illustration 3, which draws upon the data in Table 13 of Vital Statistics for Philadelphia, which shows the relative death rates for eight frequent causes of death by race per 100,000 population. The diagram clearly indicates the much higher rate for African Americans who died of consumption — almost twice the rate for the white population. By contrast, the rate for African Americans in other categories was similar, slightly higher, or even lower. Because consumption accounted for such a high proportion of deaths, however, the death rate from all causes was for African Americans (3,124 deaths per 100,000 population) was about one-third higher than for the white population (2,269 deaths). The data for these specific causes was consistent with data from Vital Statistics for the city of Philadelphia indicating that the death rate was approximately 50% higher for African Americans (29.52 per 1,000 population) as for the white population (21.54 per 1,000 population).
For all of the value of this statistical analysis, however, it is important to remember that diagrams and tables are only representations of human experience. A review of obituaries published in the Philadelphia Inquirer during the six years covered by this edition of Vital Statistics has located more than one hundred victims of consumption, the more popular term for this disease. The demographic profile of these individual victims followed the broader patterns seen in Vital Statistics: two-thirds of those with identifiable ages were between 20 and 50 years and more than 90% were white. Men were significantly over-represented in this sample, however, due to the factors such as professional standing, political activities, or legal involvement that led individual deaths to be reported in newspapers.
Yet the greatest value of combining statistical analysis with an examination of newspaper records is the possibility of humanizing data by telling the broader story of tuberculosis through examples of real people. On December 24, 1186, Susan Kemper died “suddenly” at her home, 2323 North Third Street, age 22, after she had “long been a sufferer from consumption.” (Philadelphia Inquirer, December 25, 1886). On May 20, 1888, two people in this same age cohort, Annie Gabelman, age 25, and Harry Lindner, age 32, both died of consumption at their homes. (Philadelphia Inquirer, May 21, 1888), Finally, Joseph Lesley, age 58, died in early February 1889, after spending the winter traveling through the South and West in search of a cure. He spent many years as secretary of the Pennsylvania Railroad Company, until his “failing health admonished him to give up all active work.” (Philadelphia Inquirer, February 12, 1889). These four deaths were only a tiny fraction of the thousands of deaths from consumption in this five year period in just one city, yet they are essential for thinking about the impact of this disease on American society.
References
Vital Statistics of Boston and Philadelphia, covering a period of six years ending May 31,1890 (Washington: Government Printing Office, 1895). Available from Medical Heritage Library, https://archive.org/details/vitalstatistics00shungoog


